Lumiere’s Indicator BundleThe Lumiere’s Indicator Bundle combines three of Lumiere’s most used tools into one script:
🔹 BOS Mark-out – Marks Breaks of Structure with clear bullish/bearish levels and optional alerts.
🔹 Liquidity Mark-ou t – Draws significant swing highs/lows and automatically removes them once swept.
🔹 Trading Session High/Low – Tracks Asia, London, and New York session ranges with customizable timezone.
Why this bundle?
I made this bundle so everyone can run all my indicators at once without having to pick and choose between them or worry about chart space limits.
Instead of loading 3 separate indicators, this package gives you everything in one place. You can toggle each module (BOS, Liquidity, Sessions) on or off from the settings. All inputs are kept clean and organized in their own sections for easy adjustments.
What to expect
BOS lines always plotted on top for maximum clarity.
Liquidity highs/lows update in real time and get removed when taken out.
Session ranges show the active session’s high/low and can mark sweeps after the session closes.
Default timezone is New York (UTC-4), but you can switch to any TradingView-supported timezone.
BOS alerts are included, so you’ll never miss a structural break.
ابحث في النصوص البرمجية عن "session high"

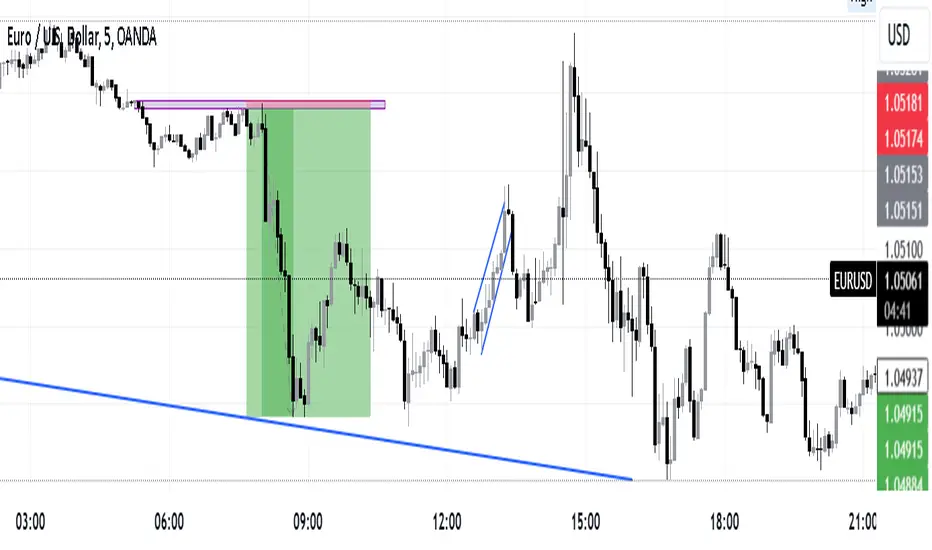
Bearish Breakaway Dual Session-FVGInspired by the FVG Concept:
This indicator is built on the Fair Value Gap (FVG) concept, with a focus on Consolidated FVG. Unlike traditional FVGs, this version only works within a defined session (e.g., ETH 18:00–17:00 or RTH 09:30–16:00).
See the Figure below as an example:
Bearish consolidated FVG & Bearish breakaway candle
Begins when a new intraday high is printed. After that, the indicator searches for the 1st bearish breakaway candle, which must have its high below the low of the intraday high candle. Any candles in between are part of the consolidated FVG zone. Once the 1st breakaway forms, the indicator will shades the candle’s range (high to low). Then it will use this candle as an anchor to search for the 2nd, 3rd, etc. breakaways until the session ends.
Session Reset: Occurs at session close.
Repaint Behavior:
If a new intraday (or intra-session) high forms, earlier breakaway patterns are wiped, and the system restarts from the new low.
Counter:
A session-based counter at the top of the chart displays how many bullish consolidated FVGs have formed.
Settings
• Session Setup:
Choose ETH, RTH, or custom session. The indicator is designed for CME futures in New York timezone, but can be adjusted for other markets.
If nothing appears on your chart, check if you loaded it during an inactive session (e.g., weekend/Friday night).
• Max Zones to Show:
Default = 3 (recommended). You can increase, but 3 zones are usually most useful.
• Timeframe:
Best on 1m, 5m, or 15m. (If session range is big, try higher time frame)
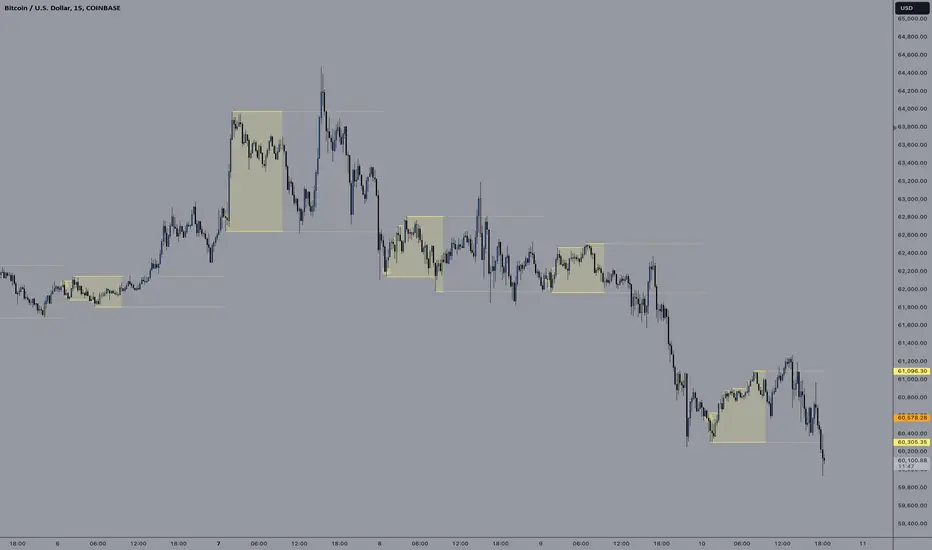
Usage:
See this figure as an example
1. Avoid Trading in Wrong Direction
• No Bearish breakaway = No Short trade.
• Prevents the temptation to countertrade in strong uptrends.
2. Catch the Trend Reversal
• When a bearish breakaway appears after an intraday high, it signals a potential reversal.
• You will need adjust position sizing, watch out liquidity hunt, and place stop loss.
• Best entries of your preferred choices: (this is your own trading edge)
Retest
Breakout
Engulf
MA cross over
Whatever your favorite approach
• Reversal signal is the strongest when price stays within/below the breakaway candle’s
range. Weak if it breaks above.
3. Higher Timeframe Confirmation
• 1m can give false reversals if new lows keep forming.
• 5m often provides cleaner signals and avoids premature reversals.
Summary
This indicator offers 3 main advantages:
1. Prevents wrong-direction trades.
2. Confirms trend entry after reversal signals.
3. Filters false positives using higher timeframes.
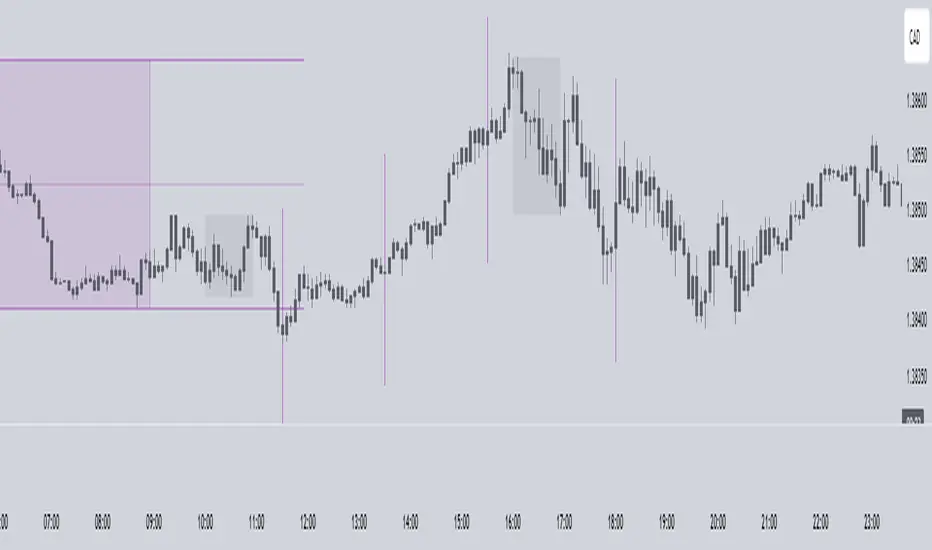
Failed example:
Usually happen if you are countering a strong trend too early and using 1m time frame
Last Mention:
The indicator is only used for bearish side trading.

Prev D/W/M + Asia & London Levels [Oeditrades]Prev D/W/M + Asia & London Levels
Author: Oeditrades
Platform: Pine Script® v6
What it does
Plots only the most recent, fully completed:
Previous Day / Week / Month highs & lows
Asia and London session highs & lows
Levels are drawn as true horizontal lines from the period/session start and extended to the right for easy confluence reading. The script is non-repainting.
How it works
Prev Day/Week/Month: Uses completed HTF candles (high / low ) so values are fixed for the entire next period.
Sessions (NY time): Asia (default 20:00–03:00) and London (default 03:00–08:00) are tracked in America/New_York time. High/low are locked when the session ends, and the line is anchored at that session’s start.
Inputs & customization
Visibility: toggle Previous Day/Week/Month, Asia, London, and labels.
Colors: highs default red; lows default green (user-configurable). Session highs default pink, lows aqua (also editable).
Style: line style (solid/dotted/dashed) and width.
Sessions: editable time windows for Asia and London (still interpreted in New York time).
Disclaimer: optional on-chart disclaimer panel with editable text.
Notes
Works on any timeframe. For intraday charts, the HTF values remain constant until the next HTF bar completes.
If your market’s overnight hours differ, simply adjust the session windows in Inputs.
Lines intentionally show only the latest completed period/session to keep charts clean.
Use cases
Quick view of PDH/PDL, PWH/PWL, PMH/PML for bias and liquidity.
Intraday planning around Asia/London range breaks, retests, and overlaps with prior levels.
Disclaimer
This tool is for educational purposes only and is not financial advice. Markets involve risk; past performance does not guarantee future results.

ICT/SMC Liquidity Map V3 KyroowThe indicator is designed to map liquidity on the chart following the ICT/SMC logic, with the added feature of precise tracking of the Asian session.
It shows you:
PDH / PDL → Previous Day High & Low, automatically removed once taken out.
EQH / EQL → Equal Highs & Equal Lows (double tops/bottoms), with pip tolerance and a check to ensure no candle has already "cleared" the range.
ASH / ASL → Asian Session High & Low (the highs/lows of each closed Asian session).
Asian Session → Displayed as a box or shaded area, with visual history.
Dynamic tolerance management → EQH/EQL can have different tolerances depending on the timeframe.
Automatic removal → Levels are removed once the market takes them (via wick or body, configurable).
💡 In practice:
It helps you quickly identify likely liquidity grab zones, whether they come from the previous day, the Asian session, or equal highs/lows. This allows you to anticipate market reactions around these levels.

Night Session Highlight with Timezone (Valehson)Highlights this time range from 21:00 to 09:00 with a gray background with 90% transparency.

Dual Session ORB S/R Lines Pro by Yendor_BShort description:
Clean opening-range breakout support/resistance lines for London and US sessions with confirmed breakout labels and alert-ready signals. UTC-based, adjustable start point, customizable styling, minimal clutter.
Detailed description:
What it does:
Captures the Opening Range (default first 15 minutes) for London and New York (US) sessions in UTC, plots the high and low as support/resistance lines, and marks confirmed breakouts when price closes beyond those levels. Lines can begin at either the range end or session start and persist for the configured session length.
Key Features:
ORB defined over the first N minutes after session open (configurable, default 15).
Two sessions: London and US (New York) with separate start times.
High/low support & resistance lines per session:
Selectable start point: Range End or Session Start.
Independently customizable color, width, and style (solid/dashed/dotted) for each high and low.
Confirmed breakout labels: only on the first candle that closes beyond the ORB high or low after the range completes (prior close must be inside).
Alerts and alertconditions for breakout long/short per session, usable in TradingView’s alert dialog.
Fully UTC-based. Works on any timeframe; 1-minute or 5-minute recommended for precision.
Minimal visual clutter; no persistent shaded boxes in this version.
Inputs explained:
ORB Duration (minutes): Length of the opening range used to calculate session high and low.
Session Length (hours): How long the S/R lines remain active (typically full session).
London / US Start (UTC): Session open times in UTC.
Line Start Point: Choose whether the lines begin at the range end or at the session start.
High/Low Styling: Independent color, thickness, and style for each session’s high and low.
Breakout Labels: Toggle one-time confirmed breakout annotations.
Alerts: Enable breakout alert messages.
Example workflows:
Monitor the first 15 minutes of the London session.
After the range, wait for a candle to close beyond the high or low for a confirmed breakout.
Use the label or alert to trigger entry logic (retest, continuation, etc.).
Repeat for the US session; compare overlaps for higher conviction.
Alert setup:
Open the Alerts panel. Choose one of the built-in alertconditions: London Breakout Long, London Breakout Short, US Breakout Long, US Breakout Short. Set frequency to Once Per Bar Close. Customize notification/webhook payload if automating.
Preset suggestions:
Standard London ORB: 15 minute range, lines from range end, green high / lime low.
Standard US ORB: 15 minute range, lines from range end, blue high / aqua low.
Overlap Bias: Both sessions active, lines start from session start, differentiated styles.
Tips & best practices:
Combine with external volume or volatility filters to reduce false breakouts. Use on correlated pairs to observe consistent session structure. Treat broken ORB levels as flipped support/resistance on revisit. Prefer confirmed closes beyond lines rather than wick touches.
Limitations / disclaimer:
Provides structural visualization and breakout signaling; does not guarantee profitability. Always apply proper risk management and confirm with additional context. Backtest settings before live use.
Tags:
#ORB #OpeningRangeBreakout #SessionTrading #LondonSession #NewYorkSession #SupportResistance #Breakout #Intraday #Pinev6 #TradingView #Forex #TrendStructure #Alerts #USD #EURUSD #TradingSignals #UTCBased #PriceAction #MarketStructure #IntradayBreakouts

OBR 15min Session Opening Range Breakout + Volume Trend DeltaQuick Overview
This Pine Script plots the opening range for London and New York sessions, highlights breakout levels, draws previous session pivots, and offers a live volume delta table for trend confirmation.
Session Opening Range
- Captures the high/low of the first 15 minutes (configurable) for both London & NY sessions.
- Fills the range area with adjustable semi‑transparent colors.
- Optional alerts fire on breakout above the high or below the low.
Previous Session Levels
- Automatically draws previous day’s High, Low, Open and previous 4‑hour High/Low.
- Helps identify key S/R zones as price approaches ORB breakouts.
Volume Trend Delta
- Uses a CMO‑weighted moving average and ATR bands to detect trend state.
- Accumulates bullish vs. bearish volume during each trend.
- Displays Bull Vol, Bear Vol, and Delta % in a movable table for quick strength checks.
How to Use
1. Let the opening range complete (first 15 min).
2. Look for price closing above/below the ORB—enter long on an upside break, short on a downside break.
3. Check the Volume Delta table: positive delta confirms buying strength; negative delta confirms selling pressure.
4. Use previous day/4h levels as additional support/resistance filters.
Settings & Customization
- ORB Duration & Session Times (London/NY), fill colors, and toggles.
- Enable/disable Previous Day & 4H levels.
- Trend Period, Momentum Window, and Delta table position/size.
- Pre‑built alert conditions for all ORB breakouts.
Developer Notes
- Fully commented for easy adjustments.
- Modular sections: ORB, previous levels, trend delta, and alerts.
- No external libraries—pure Pine Script v6.
Tip
Combine ORB breakouts with Volume Delta and prior session pivots to filter false signals and trade stronger, more reliable moves.

Institutional Sessions Overlay (Asia/London/NY)Institutional Sessions Overlay is a professional TradingView indicator that visually highlights the main trading sessions (Asia, London, and New York) directly on your chart.
Customizable: Easily adjust session start and end times (including minutes) for each market.
Timezone Alignment: Shift session boxes using the timezone offset parameter so sessions match your chart’s timezone exactly.
Clear Visuals: Colored boxes and optional labels display session opens and closes for fast institutional market structure reference.
Toggle Labels: Show or hide session open/close labels with a single click for a clean or detailed look.
Intuitive UI: User-friendly grouped settings for efficient configuration.
This tool is designed for day traders, institutional traders, and anyone who wants to instantly recognize global session timing and ranges for SMC, ICT, and other session-based strategies.
How to use:
Set your chart to your local timezone.
Use the "Session timezone offset" setting if session boxes do not match actual session opens on your chart.
Adjust the hours and minutes for each session as needed.
Enable or disable labels in the “Display” settings group.
Tip: Use the overlay to spot session highs and lows, volatility windows, and institutional liquidity sweeps.

Session Makers v1
Session Makers v1 - Professional Trading Session Visualizer
This advanced indicator highlights key trading sessions and market structure levels, helping traders identify optimal trading times and important price levels.
Key Features:
Session Time Markers
- Vertical dotted lines at major market opens (London/New York)
- Appears 30 minutes before each session for early preparation
Interactive Session Boxes
- Asia Session (22:00-06:00 GMT) - Blue shaded area
- London AM (08:00-09:00 GMT) - Gray shaded area
- London/New York Overlap (14:00-15:00 GMT) - Gray shaded area
Key Reference Levels
- Yesterday's high/low (with touch alerts)
- Previous week's high/low (with touch alerts)
- Asia session high/low/mid lines
Smart Visual Design
- Clean, non-cluttered visuals that adapt to your chart
- Customizable colors and transparency for all elements
- Optimized for all timeframes (M1-H4)
only use in timeframes <= 15 min
Apex Edge - Session Sweep ProApex Edge Session Sweep Pro
By Apex Edge | 2025 Edition
🔍 What is it?
The Apex Session Sweep Pro is a precision trading tool designed for identifying high-probability liquidity sweep entries during key global market sessions. It combines powerful sweep detection logic with dynamic candle colouring, session visualization, TP projections, and real-time alerts — all within a clean, performance-optimized Pine Script engine.
This is not your average session box indicator. This is Apex-grade.
⚙️ How it Works
The indicator detects session liquidity sweeps by tracking price action relative to previous session highs and lows. When a session high/low is swept (i.e., price breaches it and then closes in the opposite direction), it generates a signal:
Buy Signal → Price sweeps previous low and closes back above it
Sell Signal → Price sweeps previous high and closes back below it
Each session is boxed on the chart (Tokyo, London, New York, Sydney), color-coded, and dynamically labelled.
Upon detecting a valid sweep, the script:
Plots a small entry label (toggleable)
Projects up to 5 customizable TP levels
Coloured candles for visual trade direction
Alerts for Buy or Sell sweep signals (optional)
All elements are memory-managed and customizable to suit your trading style.
🧠 Key Features
✅ Smart Sweep Detection Logic
✅ Global Market Session Boxes (Custom Times)
✅ Toggleable Entry Labels + TP Levels
✅ Candle Colouring by Signal
✅ Manual TP input + TP toggles
✅ Real-time Alerts for Apex entries
🕒 Why Are My Sessions Offset?
Your chart’s time zone may be different from UTC. This script is UTC-based by design, so if your chart is set to UTC+1, for example, the sessions will appear one hour later. Either:
Adjust your chart to UTC or or Exchange for perfect alignment,
Or tweak the session input times manually.
🧰 Who is this for?
This tool is made for:
Intraday traders looking for sweeps into liquidity
SMC (Smart Money Concept) strategists
Forex, crypto, and indices traders
Anyone who uses session-based levels to define entries
Whether you scalp London or ride NY swings, this tool frames each session cleanly — and shows you where the traps are laid.
🚨 Disclaimer
This indicator is a technical tool, not financial advice. Use proper risk management. Past performance ≠ future results.

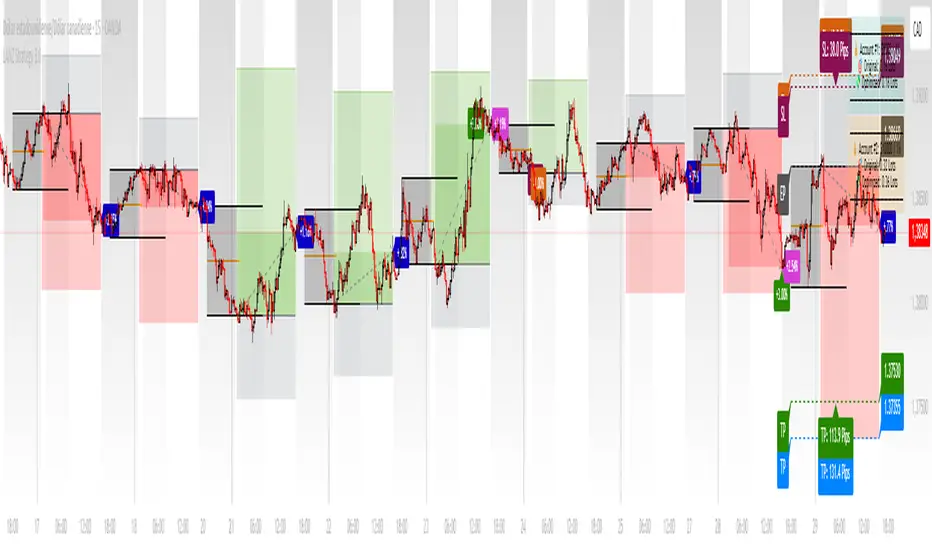
LANZ Strategy 3.0🔷 LANZ Strategy 3.0 — Asian Range Fibonacci Strategy with Execution Window Logic
LANZ Strategy 3.0 is a rule-based trading system that utilizes the Asian session range to project Fibonacci levels and manage entries during a defined execution window. Designed for Forex and index traders, this strategy focuses on structured price behavior around key levels before the New York session.
🧠 Core Components:
Asian Session Range Mapping: Automatically detects the high, low, and midpoint during the Asian session.
Fibonacci Level Projection: Projects configurable Fibonacci retracement and extension levels based on the Asian range.
Execution Window Logic: Uses the 01:15 NY candle as a reference to validate potential reversals or continuation setups.
Conditional Entry System: Includes logic for limit order entries (buy or sell) at specific Fib levels, with reversal logic if price breaks structure before execution.
Risk Management: Entry orders are paired with dynamic SL and TP based on Fibonacci-based distances, maintaining a risk-reward ratio consistent with intraday strategies.
📊 Visual Features:
Asian session high/low/mid lines.
Fibonacci levels: Original (based on raw range) and Optimized (user-adjustable).
Session background coloring for Asia, Execution Window, and NY session.
Labels and lines for entry, SL, and TP targets.
Dynamic deletion of untriggered orders after execution window expires.
⚙️ How It Works:
The script calculates the Asian session range.
Projects Fibonacci levels from the range.
Waits for the 01:15 NY candle to close to validate a signal.
If valid, a limit entry order (BUY or SELL) is plotted at the selected level.
If price structure changes (e.g., breaks the high/low), reversal logic may activate.
If no trade is triggered, orders are cleared before the NY session.
🔔 Alerts:
Alerts trigger when a valid setup appears after 01:15 NY candle.
Optional alerts for order activation, SL/TP hit, or trade cancellation.
📝 Notes:
Intended for semi-automated or discretionary trading.
Best used on highly liquid markets like Forex majors or indices.
Script parameters include session times, Fib ratios, SL/TP settings, and reversal logic toggle.
Credits:
Developed by LANZ, this script merges traditional session-based analysis with Fibonacci tools and structured execution timing, offering a unique framework for morning volatility plays.
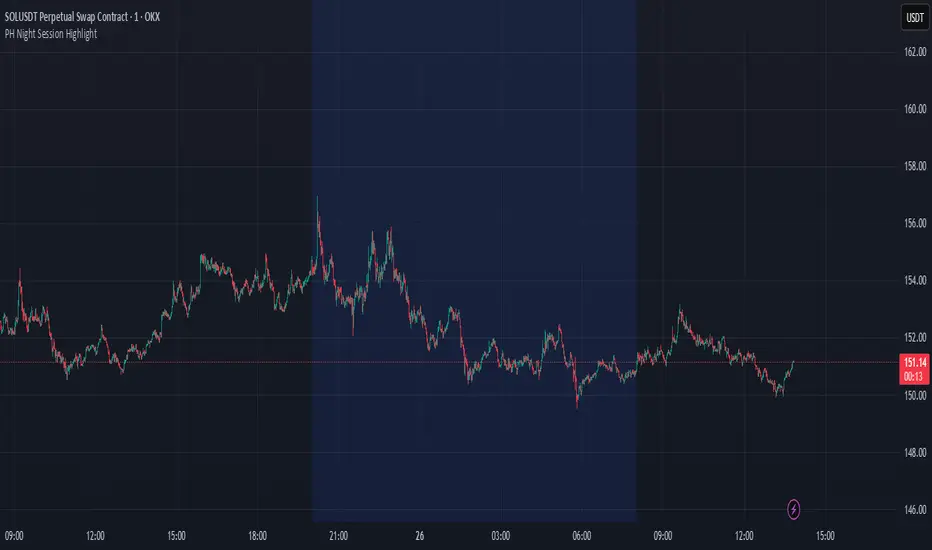
PH Night Session HighlightTraders who want to visually separate the night session on their charts. It highlights the period from 8:01 PM to 7:59 AM (Philippine Time), making it easy to distinguish off-hours or pre-market activity, especially when analyzing crypto or 24/7 markets.
The script automatically adjusts server time (UTC) to Philippine Time (UTC+8) and overlays a soft blue background during the specified time window.
cd_full_poi_CxOverview
This indicator tracks the price in 16 different time frames (optional) in order to answer the question of where the current price has reacted or will react.
It appears on the chart and in the report table when the price approaches or touches the fvg or mitigations (order block / supply-demand), the rules of which will be explained below.
In summary, it follows the fvg and mitigations in the higher timeframe than the lower timeframe.
Many traders see fvg or mitigates as an point of interest and see the high, low swept in those zones as a trading opportunity. Key levels, Session high/lows and Equal high and lows also point of interest.
If we summarise the description of the point of interest ;
1- Fair value gaps (FVG) (16 time frames)
2- Mitigation zones (16 time frames)
3- Previous week, day, H4, H1 high and low levels
4- Sessions zones (Asia, London and New York)
5- Equal high and low levels are in indicator display.
Details:
1- Fair Value Gaps : It is simply described as a price gap and consists of a series of 3 candles. The reaction of the price to the gap between the 1st and 3rd candle wicks is observed.
The indicator offers 3 options for marking. These are :
1-1- ‘Colours are unimportant’: candle colours are not considered for marking. Fvg formation is sufficient.(Classical)
1-2- ‘First candle opposite colour’ : when a price gap occurs, the first candle of a series of 3 candles must be opposite.
For bullish fvg : bearish - bullish - free
For Bearish fvg : bullish - bearish - free
1-3- ‘All same colour’ : all candles in a series of 3 candles must be the same direction.
For bullish fvg: bullish - bullish - bullish
For bearish fvg : bearish - bearish – bearish
Examples:
2- Mitigation zones: Opposite candles with a fvg in front of them or candles higher/lower than the previous and next candle and with the same colour as the fvg series are marked.
Examples :
3- Previous week, day, H4, H1 high and low levels
4- Sessions regions (Asia, London and New York)
5- Equal high and low levels:
Annotation: Many traders want to see a liquidity grab on the poi, then try to enter the trade with the appropriate method.
Among the indicators, there is also the indication of grabs/swepts that occur at swing points. It is also indicated when the area previously marked as equal high/low is violated (grab).
At the end, sample setups will be shown to give an idea about the use of the indicator.
Settings:
- The options to be displayed from the menu are selected by ticking.
- 1m, 2m, 3m, 5m, 5m, 10m, 15m, 30m, h1, h4, h4, h6, h8, h12, daily, weekly, monthly and quarterly, 16 time zones in total can be displayed.
- The ‘Collapse when the price touches mitigate’ tab controls whether to collapse the box as the price moves into the inner region of the mitigate. If not selected, the size of the mitigate does not change.
- ‘Approach limit =(ATR / n)’ tab controls how close the price is to the fvg or mitigate. Instant ATR(10) value is calculated by dividing by the entered ‘n’ value.
- All boxes and lines are automatically removed from the screen when the beyond is closed.
- Colour selections, table, text features are controlled from the menu.
- Sessions hours are set as standard hours, the user can select special time zones. Timezone is set to GMT-4.
- On the candle when the price touches fvg or mitigate, the timeframe information of the POI is shown in the report table together with the graphical representation.
The benefits and differences :
1- We can evaluate the factors we use for setup together.
2- We are aware of what awaits us in the high time frame in the following candles.
3- It offers the user the opportunity to be selective with different candle selection options in fvg selection.
4- Mitige areas are actually unmitige areas because they have a price gap in front of them. The market likes to retest these areas.
5- Equal high/low zones are the levels that the price creates to accumulate liquidity or fails to go beyond (especially during high volume hours). Failure or crossing of the level may give a reversal or continuation prediction.
Sample setup 1:
Sample setup 2:
Sample setup 3:
Cheerful trades…
Enjoy…

RTH and ETH RangesKey Functions :
Visualizes Regular Trading Hours (RTH) and Extended Trading Hours (ETH) price ranges
Tracks session highs, lows, and 50% levels where significant market reactions occur
Detects breakouts beyond previous session extremes
Trading Applications :
Exposes potential liquidity raids at session boundaries where smart money targets stop orders
Identifies critical price thresholds where institutional activity concentrates
Highlights divergences between RTH and ETH behavior that precede directional moves
Provides measurement of session volatility differences
Maps key price levels for objective entry and exit parameters
Reveals market dynamics at session transitions where institutional positioning changes

NYCSessionLibrary "NYCSession"
Library for New York trading session time functions
@author abneralvarado
@version 1.0
isInNYSession(sessionStart, sessionEnd)
Determines if the current bar is within New York trading session
Parameters:
sessionStart (simple int) : Starting time of NY session in 24hr format (HHMM) like 0930 for 9:30 AM ET
sessionEnd (simple int) : Ending time of NY session in 24hr format (HHMM) like 1600 for 4:00 PM ET
Returns: True if current bar is within the NY session time, false otherwise
getNYSessionStartTime(lookback, sessionStart)
Gets the start time of NY session for a given bar
Parameters:
lookback (simple int) : Bar index to check (0 is current bar)
sessionStart (simple int) : Starting time of NY session in 24hr format (HHMM)
Returns: Unix timestamp for the start of NY session on the given bar's date
getNYSessionEndTime(lookback, sessionEnd)
Gets the end time of NY session for a given bar
Parameters:
lookback (simple int) : Bar index to check (0 is current bar)
sessionEnd (simple int) : Ending time of NY session in 24hr format (HHMM)
Returns: Unix timestamp for the end of NY session on the given bar's date
isNYSessionOpen(sessionStart)
Checks if current bar opens the NY session
Parameters:
sessionStart (simple int) : Starting time of NY session in 24hr format (HHMM)
Returns: True if current bar marks the session opening, false otherwise
isNYSessionClose(sessionEnd)
Checks if current bar closes the NY session
Parameters:
sessionEnd (simple int) : Ending time of NY session in 24hr format (HHMM)
Returns: True if current bar marks the session closing, false otherwise
isWeekday()
Determines if the current day is a weekday (Mon-Fri)
Returns: True if current bar is on a weekday, false otherwise
getSessionBackgroundColor(sessionStart, sessionEnd, bgColor)
Gets session background color with transparency
Parameters:
sessionStart (simple int) : Starting time of NY session in 24hr format (HHMM)
sessionEnd (simple int) : Ending time of NY session in 24hr format (HHMM)
bgColor (color) : Background color for session highlighting
Returns: Color value for background or na if not in session

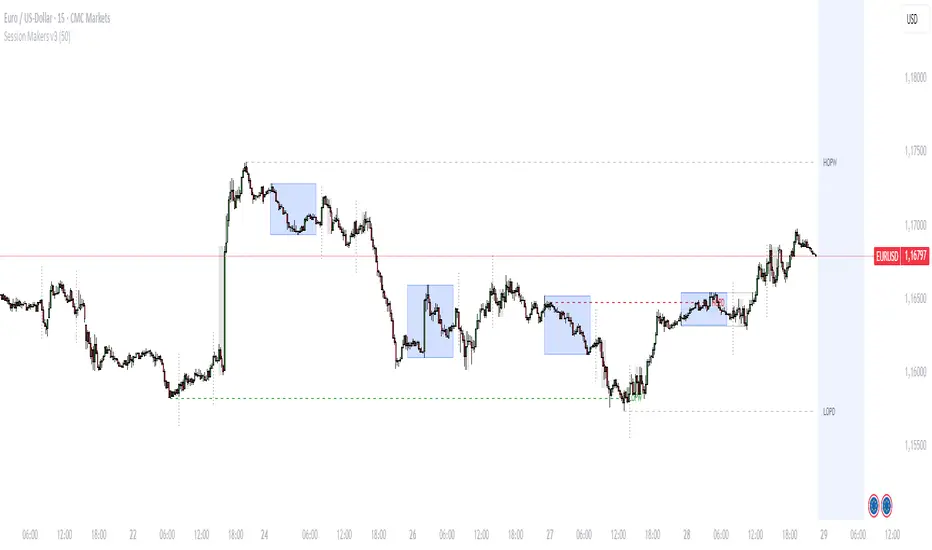
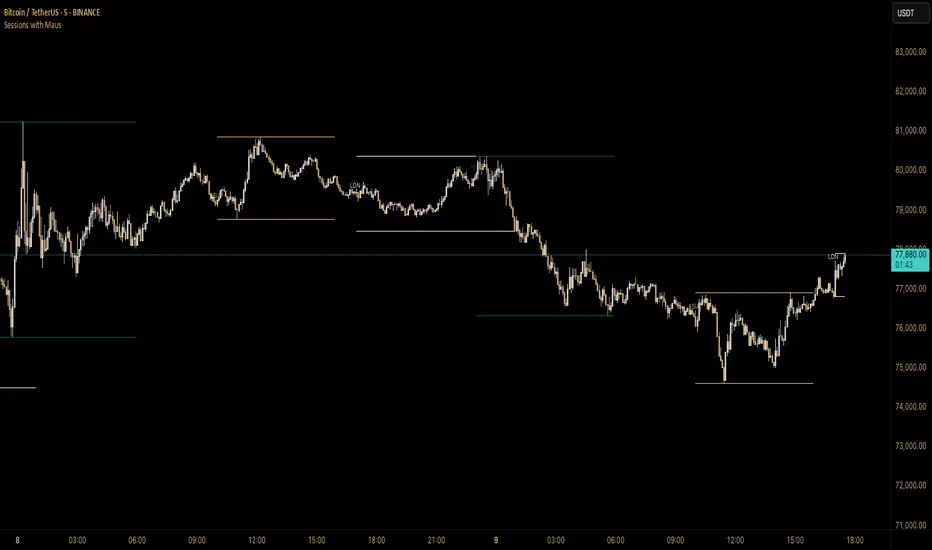
Sessions with Mausa session high/low tracker that draws flat, horizontal lines for Asia, London, and New York trading sessions. It updates those levels in real time during each session, locks them in once the session ends, and keeps them on the chart for context.
At a glance, you always know:
Where each session’s highs and lows were set
Which session produced them (ASIA, LDN, NY labels float cleanly above the highs)
When price is approaching or reacting to prior session levels
🔹 Use Cases:
• Key Levels – See where Asia, London, or NY set boundaries, and watch how price respects or rejects them
• Breakout Zones – Monitor when price breaks above/below session highs/lows
• Session Structure – Know instantly if a move happened during London or NY without squinting at the clock
• Backtesting – Keep historic session levels on the chart for reference — nothing gets deleted
• Confluence – Align these levels with support/resistance, fibs, or liquidity zones
Simple, visual, no distractions — just session structure at a glance.
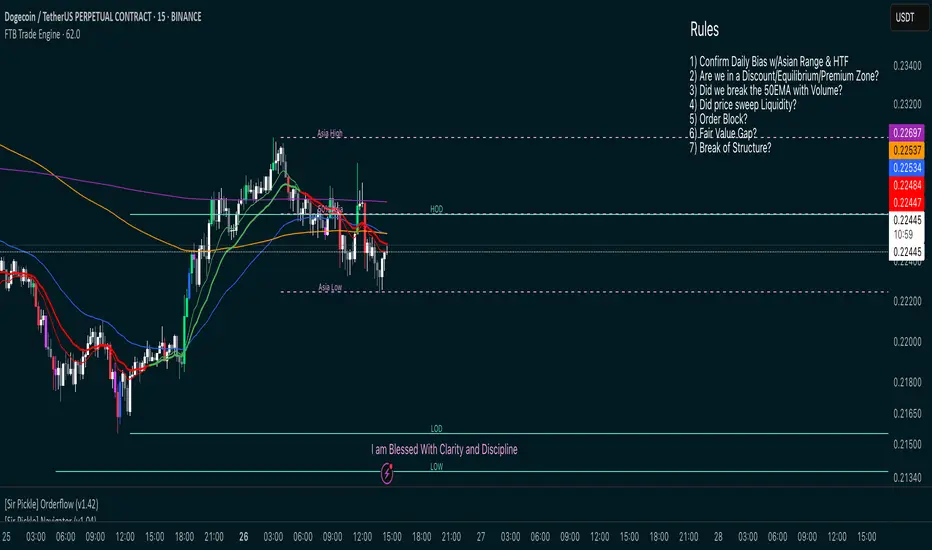
FTB Smart Trader System — Market Maker Levels, EMAs & VectorsThe FTB Trade Engine is an indicator suite I built for myself as a crypto trader. It's designed specifically for trading Institution levels, EMAs, PVSRA Volume Candles, and Session Timings. It helps me spot high probability trade setups without overcomplicating things.
🔑 Features of this Indicator
📌 🔥 Key Session Levels (extend lines in settings as needed)
✅ Weekly High & Low (HOW/LOW) — Automatically plots the previous week's high and low
✅ Daily High & Low (HOD/LOD) — Marks the prior day's range
✅ Asia Session High & Low — Plots the Asian session’s high and low, helping you detect potential breakouts or fakeouts, as Asia often sets the initial high and low of the day.
✅ 50% Asia Level — Automatically calculates and displays the midpoint between Asia’s high and low, an important level for intraday trading.
📌 🔥 Advanced EMA Suite
✅ Includes 10, 20, 50, 200, and 800 EMAs — providing key zones of support, resistance, and trend direction.
👀 Good to know: the break of the 50EMA WITH a vector candle is significant for reversals.
📌 🔥 PVSRA Candles
(👀 IMPORTANT: To properly view PVSRA candles, make sure to UNCHECK all default candle settings — Color Bars, Body, Borders, and Wick — in your chart's candle settings.)
✅ Price, Volume, Support & Resistance Analysis (PVSRA) Candles — These special candles combine price action with volume analysis, color-coded to highlight areas potentially influenced by market makers, institutions, and large players. Perfect for identifying key volume zones and quickly analyzing any coin or pair without switching tools.
Candle Colors Explained:
Bullish Candles:
🟢 Green — 200% increase in volume on bullish moves (strong buyer presence).
🔵 Blue — 150% increase in bullish volume, but may also indicate fatigue or possible reversal.
⚪ White — Normal bullish volume (standard green candles).
Bearish Candles:
🔴 Red — 200% increase in bearish volume compared to the last 10 candles (strong selling).
🟣 Magenta — 150% increase in bearish volume, signaling possible continuation or exhaustion.
⚫ Gray — Normal bearish volume (standard red candles).
AEST High-Low MarkerOverview
This TradingView indicator, AEST High-Low Marker, is designed to mark the highest and lowest price levels observed between 5:00 PM and 6:00 PM AEST and extend these levels visually on the chart only between 5:00 PM and 12:00 AM AEST.
Functionality
Time Conversion for AEST
Since TradingView operates in UTC, the script translates AEST (UTC+10 or UTC+11 during daylight savings) into UTC time.
The script starts tracking from 5:00 PM AEST (7 AM UTC) to 6:00 PM AEST (8 AM UTC).
The high and low lines will be displayed only between 5:00 PM and 12:00 AM AEST (7 AM to 2 PM UTC).
Real-Time High & Low Calculation
The indicator dynamically updates the session high and low as new candles form during the 5 PM - 6 PM AEST period.
It captures the maximum high and minimum low during this timeframe.
Line Display Restrictions
The session high and low lines will only be drawn between 5:00 PM and 12:00 AM AEST to prevent chart clutter.
The lines disappear after 12:00 AM AEST.
Visual Representation
Blue Line: Marks the session high recorded between 5 PM - 6 PM AEST.
Red Line: Marks the session low recorded between 5 PM - 6 PM AEST.
Both lines extend until 12 AM AEST and then disappear.
Use Case
This indicator is useful for traders looking to track key price levels formed between 5 PM and 6 PM AEST and observe how price interacts with these levels until midnight.
It is particularly beneficial for intraday and short-term trading strategies, allowing users to identify potential support and resistance zones based on early evening price action.

Intraday -RSKWhat You See:
Session Boxes:
As you observe, the larger purple box represents the Asian Session, spanning from around 22:00 to 06:00 UTC. You notice how it captures the overnight market activity.
The smaller, greyish box marks the London Session, from about 08:00 to 12:00 UTC. You can see how the price action changes during this session.
The New York Session is also indicated, with vertical lines possibly marking the open and close, helping you track movements as the U.S. markets come into play.
High and Low Levels:
Horizontal lines are drawn at the high and low of each session. You can use these as potential support or resistance levels, aiding in your decision-making process.
Vertical Lines:
These lines likely correspond to specific key times, such as session opens or closes. You can quickly identify the transition between sessions, which is crucial for your timing.
Color Coding:
Each session is color-coded, making it easier for you to distinguish between them at a glance. The purple, grey, and additional lines offer a clear visual distinction.
How You Use It:
This indicator is your go-to for understanding how different market sessions affect price action. You’ll use it to:
Recognize important price levels within each session.
Identify potential entry and exit points based on session highs and lows.
Observe how the market transitions from one session to another, giving you insight into the best times to trade.
Customization:
You have the flexibility to adjust the settings. You can change session times to suit your trading hours, modify colors to match your chart theme, and even choose which sessions to display or hide based on your focus.
This tool is designed to enhance your analysis, providing you with a structured view of market sessions. With this indicator, you’re well-equipped to navigate the global markets with greater precision and confidence.
Open-source script
E9 ASIA Session
*note: Upon updating the script the conversion from V4 to v5 has lost the weekend extended lines and now prints an asia session for each day. It is recommended (esp for crypto) to extend these lines across the weekend like in the chart example above.
The E9 Asia Session Indicator is a valuable tool for traders aiming to track and analyze the Asia trading session on financial charts. This indicator provides insights into price behavior during the Asia session, which is crucial for making informed trading decisions. Here's an overview of its key functionalities and uses:
1. Session Highs and Lows
Purpose:
The indicator calculates and plots the high and low of the Asia session.
It helps identify key levels of support and resistance established during this trading period.
Importance:
These levels can act as significant reference points for future price movements.
Price action that occurs near these levels often provides clues about potential breakouts or reversals.
2. Session Background Color
Purpose:
The indicator can shade the background of the chart during the Asia session.
Importance:
This visual cue helps quickly identify the session's timeframe, enhancing the trader’s ability to observe price behavior within this specific period.
It aids in distinguishing between different trading sessions and understanding their influence on price action.
3. Start of Session Marker
Purpose:
A visual marker (such as a circle) is plotted at the beginning of each Asia session.
Importance:
This marker helps traders visually pinpoint the start of the session, making it easier to analyze how the price reacts from the session's opening.
4. End of Session Marker
Purpose:
A marker is plotted at the end of the Asia session, indicating where the session closes.
Importance:
This marker is useful for tracking the end of the session and observing price behavior around this critical juncture.
It helps in analyzing whether the session's high or low gets revisited or broken in subsequent sessions.
Practical Uses:
Strategic Planning: Traders can use the plotted high and low levels to set their trading strategies, stop-loss orders, and profit targets.
Market Analysis: Understanding how price interacts with the Asia session’s high and low levels can provide insights into market sentiment and potential price movements.
By incorporating the E9 Asia Session Indicator into your trading toolkit, you can gain a deeper understanding of the Asia session's impact on price dynamics, enhancing your overall trading strategy and decision-making process.
Disclaimer: The information contained in this article does not constitute financial advice or a solicitation to buy or sell any securities. All investments involve risk, and past performance does not guarantee future results. Always evaluate your financial circumstances and investment objectives before making trading decisions.
Timing - Fx MGKWhat You See:
Session Boxes:
As you observe, the larger purple box represents the Asian Session, spanning from around 22:00 to 06:00 UTC. You notice how it captures the overnight market activity.
The smaller, greyish box marks the London Session, from about 08:00 to 12:00 UTC. You can see how the price action changes during this session.
The New York Session is also indicated, with vertical lines possibly marking the open and close, helping you track movements as the U.S. markets come into play.
High and Low Levels:
Horizontal lines are drawn at the high and low of each session. You can use these as potential support or resistance levels, aiding in your decision-making process.
Vertical Lines:
These lines likely correspond to specific key times, such as session opens or closes. You can quickly identify the transition between sessions, which is crucial for your timing.
Color Coding:
Each session is color-coded, making it easier for you to distinguish between them at a glance. The purple, grey, and additional lines offer a clear visual distinction.
How You Use It:
This indicator is your go-to for understanding how different market sessions affect price action. You’ll use it to:
Recognize important price levels within each session.
Identify potential entry and exit points based on session highs and lows.
Observe how the market transitions from one session to another, giving you insight into the best times to trade.
Customization:
You have the flexibility to adjust the settings. You can change session times to suit your trading hours, modify colors to match your chart theme, and even choose which sessions to display or hide based on your focus.
This tool is designed to enhance your analysis, providing you with a structured view of market sessions. With this indicator, you’re well-equipped to navigate the global markets with greater precision and confidence.
Session VWAPS [QuantVue]The Session VWAPS indicator is a designed for traders to enhance their trading analysis by incorporating Volume Weighted Average Price (VWAP) anchored to custom-defined trading sessions.
This indicator automatically plots VWAPs at three critical points of a user defined session:
🔹session start
🔹session high
🔹session low
Additionally, it provides the option to display the VWAPs from previous sessions, offering a look at potential areas of support and resistance.
Anchored VWAP, or Anchored Volume-Weighted Average Price, is a technical analysis tool used to determine the average price of a stock weighted by volume, starting from a specific point in time chosen by the analyst.
Unlike traditional VWAP, which starts at the beginning of the trading session, the anchored VWAP allows traders to select any point on the chart, such as a significant event, price low, high, or a breakout, to begin the calculation.
VWAP incorporates price and volume in a weighted average and can be used to identify areas of support and resistance on the chart.
Indicator Features:
Custom Session Definition:
Users can define their own trading sessions by specifying start and end times, allowing for tailored analysis according to individual trading strategies or market hours.
Anchored VWAP at Three Key Points:
🔹Session Start VWAP: This VWAP is anchored at the start of the defined session.
🔹Session High VWAP: Anchored at the highest price point within the session.
🔹Session Low VWAP: Anchored at the lowest price point within the session.
Previous Session VWAPs:
The indicator can display VWAPs from the previous session, allowing traders to spot potential areas of support and resistance.
Give this indicator a BOOST and COMMENT your thoughts below!
We hope you enjoy.
Cheers!

Golden Swap (Zeiierman)█ Overview
The Golden Swap indicator, as designed by Zeiierman, focuses on identifying reversal points around the key levels indicated by the indicator. This pattern works by analyzing the relationship between current and past price movements, considering factors like price symmetry, baseline boundaries, and precision pin bar formations. It can offer insights into potential market reversals, allowing for more precise entries and exits.
█ How It Works
Golden Swap Long
In a market with bullish momentum, we expect the price to dip a bit before it continues to rise again. This dip is like a small retreat in an overall march upwards. So, the pattern aims to assess whether the current period's dip is relatively shallow, indicating that the overall bullish momentum remains robust despite temporary price fluctuations.
Golden Swap Short
In a market with bearish momentum (indicating selling pressure or bearish sentiment), we may still see the price rise a bit before continuing its drop. This temporary rise is like a slight bounce in an overall downward movement. In simpler terms, even when the price bounces up a bit, it's not strong enough to overcome the recent pressure of selling. The sellers are still dominating, and the price will likely continue to drop.
█ The signal is reinforced by symmetry, BaselineBound criteria, and a bearish Precision PinBar.
⚪ Symmetry in Price Movements: The pattern uses the Symmetry Precision filter to analyze the symmetry of recent price movements. This helps in determining the likelihood of a reversal. A high degree of symmetry suggests a more reliable reversal signal.
⚪ BaselineBound Criteria: This component involves the BaselineBound Threshold, which acts as a filter to validate the strength of the potential reversal. Bullish and bearish conditions are assessed based on how the current close price compares to a calculated range around the high and low of the previous period.
⚪ Precision PinBar Analysis: The pattern also incorporates the Precision PinBar filter, which evaluates the characteristics of the recent price bars. A Precision PinBar is a candlestick with a small body and a long tail, indicating a potential reversal.
⚪ Display of Key Levels: The indicator can show Open, High, and Low levels for selected timeframes, helping traders identify key price points.
█ How to Use
The Golden Swap pattern is a valuable confirmation tool, particularly around key levels or session highs and lows. It highlights instances where a previous high or low has been respected, followed by a price reversal—flipping back up in an upward trend (Golden Swap Long) or flipping back down in a downward trend (Golden Swap Short). When this pattern emerges near a key level, it strongly suggests that the price will continue moving in the direction indicated by the current trend.
Consider it akin to a minor liquidity hunt above the previous high or below the previous low. The presence of the Golden Swap pattern, especially when aligned with other indicators and filters, enhances its reliability as a signal for the continuation of the prevailing market trend.
█ Settings
Timeframe Selection: Choose from various timeframes for signal calculation.
Filter Adjustments: Fine-tune the Symmetry Precision, BaselineBound Threshold, and Precision PinBar settings to filter signals according to specific criteria.
Display Options for Key Levels: Enable or disable the display of key price levels and select timeframes for these levels.
█ Related script using the same pattern filtering techniques
-----------------
Disclaimer
The information contained in my Scripts/Indicators/Ideas/Algos/Systems does not constitute financial advice or a solicitation to buy or sell any securities of any type. I will not accept liability for any loss or damage, including without limitation any loss of profit, which may arise directly or indirectly from the use of or reliance on such information.
All investments involve risk, and the past performance of a security, industry, sector, market, financial product, trading strategy, backtest, or individual's trading does not guarantee future results or returns. Investors are fully responsible for any investment decisions they make. Such decisions should be based solely on an evaluation of their financial circumstances, investment objectives, risk tolerance, and liquidity needs.
My Scripts/Indicators/Ideas/Algos/Systems are only for educational purposes!
